Analytics
Watch it in Worktrim. Open as an animated GIF to share it.
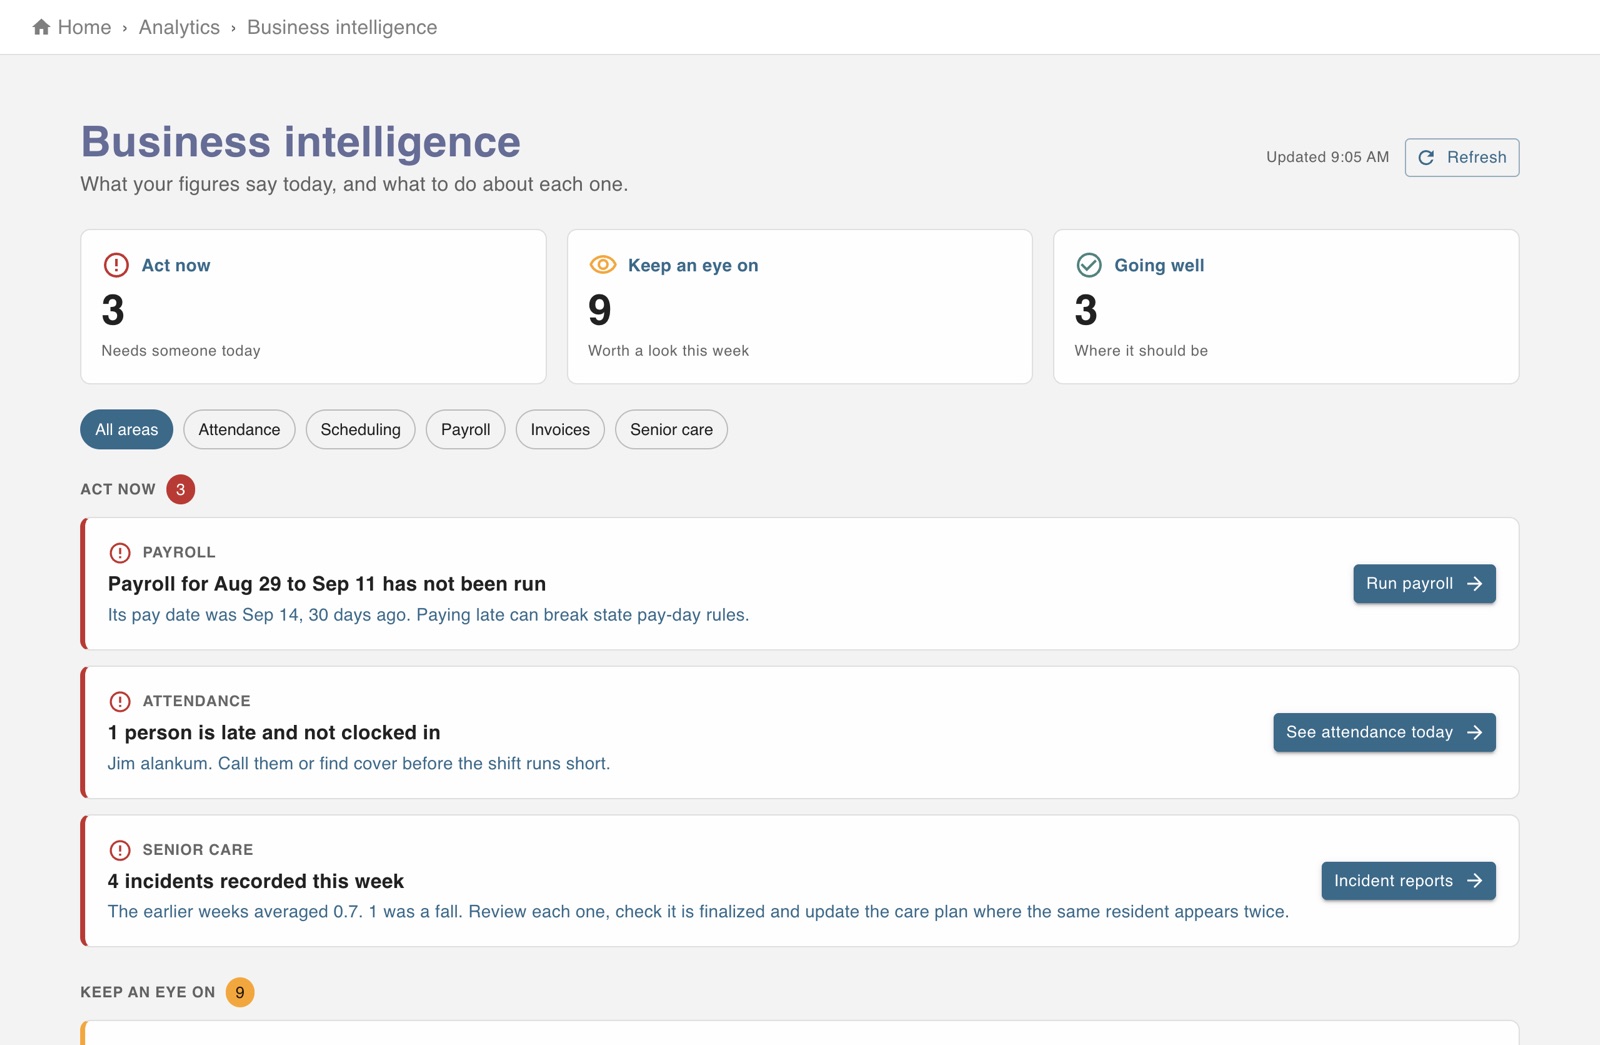
The screen in Worktrim.
Read Business intelligence
It turns your own figures into a short list of things to act on, each with a button to the screen that fixes it.
Steps
- Open Analytics, then Business intelligence.
- Findings are sorted into Act now, Keep an eye on and Going well. Press a finding's button to go and deal with it.
- “How these are worked out” at the bottom lists the lines each finding is judged against.
- Each area (attendance, scheduling, payroll, senior care, invoices) has its own analytics page with the detail.
- Every figure comes from your own records. An area with too little activity says nothing rather than guessing.
Open it in Worktrim
You will be asked to sign in if you are not already.
Was this guide helpful?
Thank you.
Sorry it did not help. Tell us what was missing and we will improve it.
Still stuck?
Email [email protected] or send us a message. The people who build Worktrim answer.
Contact us